Analytics + BI
SQL, Excel, Power BI, Tableau, SAS, Google Analytics
Data Science & Analytics
Product & Business Insights • Machine Learning • Decision Support
I support data-driven decisions by combining analytics, machine learning, and business context, partnering across teams to deliver better decisions.

Snapshot
I’m a Data Science & Analytics professional with a Master’s in Business Analytics from The George Washington University, passionate about using data to inform better decisions. My experience spans data science, research, and business analytics, where I’ve built predictive models, designed analytical dashboards, and applied statistical methods to uncover meaningful patterns. I thrive in roles that sit between data and business, working with stakeholders to translate complex analysis into insights that drive strategy, efficiency, and impact.
My experience spans data science, research, and business analytics in consulting and market research. I am passionate about leveraging data to solve business challenges and drive decision-making.
The George Washington University
Master of Science, Business Analytics | 2024
Focused on machine learning, data mining, and data visualization with applied analytics projects.
Dr. Ambedkar Institute of Technology
Bachelor of Mechanical Engineering
Built analytical foundations through engineering problem-solving and systems design.
Gear
SQL, Excel, Power BI, Tableau, SAS, Google Analytics
Python, R, sklearn, TensorFlow, statistical modeling
Prompting, RAG patterns, NLP pipelines, vector search
ETL workflows, AWS, data cleaning, pipeline automation, Git
Lab
Highlighting 10+ data projects across ML, analytics, and automation that support business and product decisions. Replace impact metrics with verified results.

Built an end-to-end bias detection workflow combining machine learning models, fairness metrics, and cohort analysis to surface potential disparities in lending outcomes. Delivered insights through a compliance-ready Power BI dashboard for decision support.

Analyzed large-scale user feedback and operational signals to identify experience pain points and opportunities for product improvement within Apple Maps.

Built a retrieval-augmented generation (RAG) system to answer insurance claim questions by grounding LLM responses in policy documents and claim guidelines.

Built churn prediction models and cohort-based risk scores to identify at-risk customers and support targeted retention strategies.

Segmented customers using behavioral and demographic data to uncover distinct customer groups and enable targeted marketing, personalization, and retention strategies.

Designed and evaluated a CNN-based pipeline for automated brain tumor detection from MRI scans, focusing on model performance, robustness, and clinical evaluation metrics.

Developed predictive models for early diabetes risk screening and analyzed feature importance to surface key clinical drivers supporting practitioner review and decision-making.

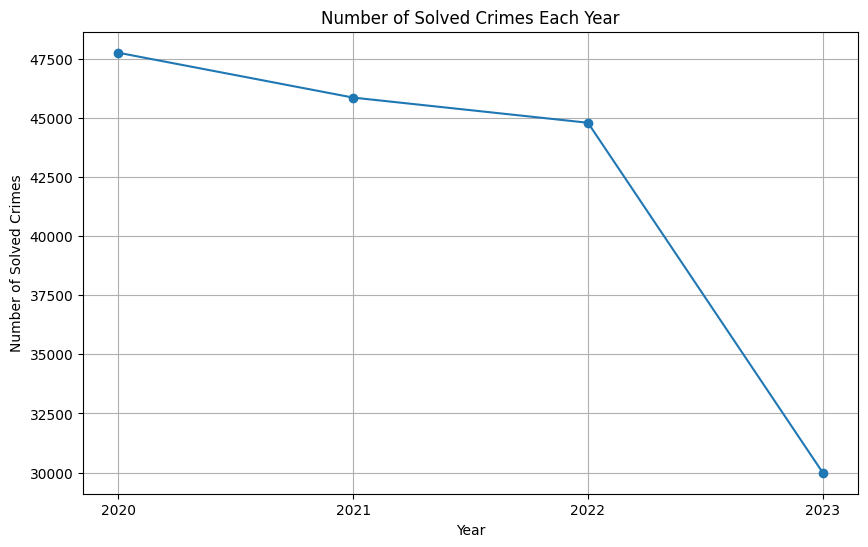
Analyzed and visualized crime data to uncover seasonal patterns, geographic hotspots, and resolution trends using interactive Tableau dashboards.
Trail
Data Science & Analytics Analyst | Mar 2025 - Present
Research Assistant | Oct 2024 - Dec 2024
Data Scientist | Jan 2024 - May 2024
Analyst | Apr 2022 - Jul 2023
Analyst Intern | Nov 2021 - Apr 2022
Certifications
Certified in measurement planning, reporting, and optimization.
Validated skills across ML pipelines and Azure ML services.
Contact
Email is the fastest way to reach me. I respond within 24 hours.
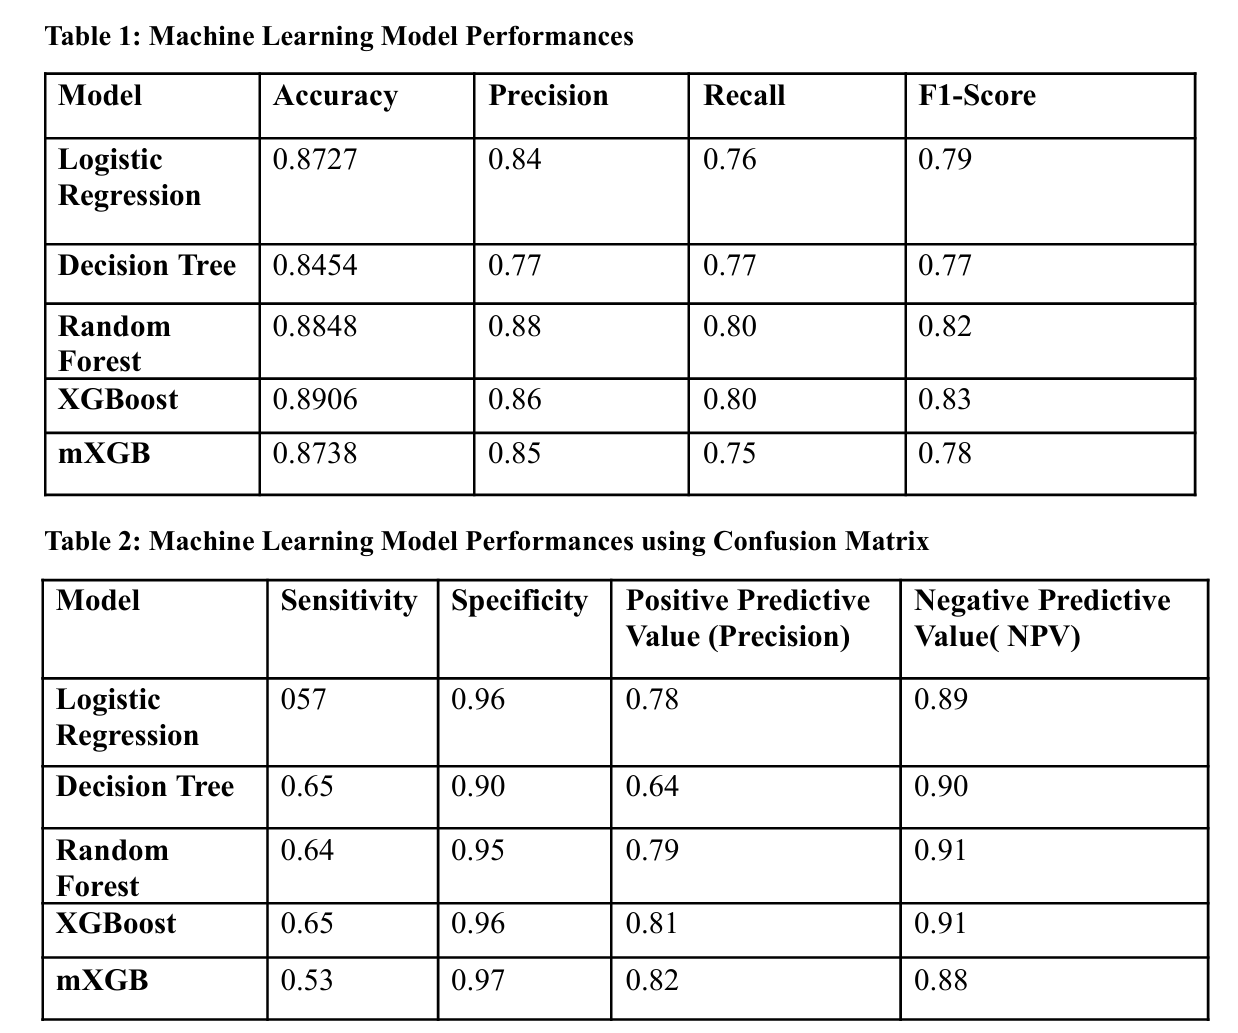
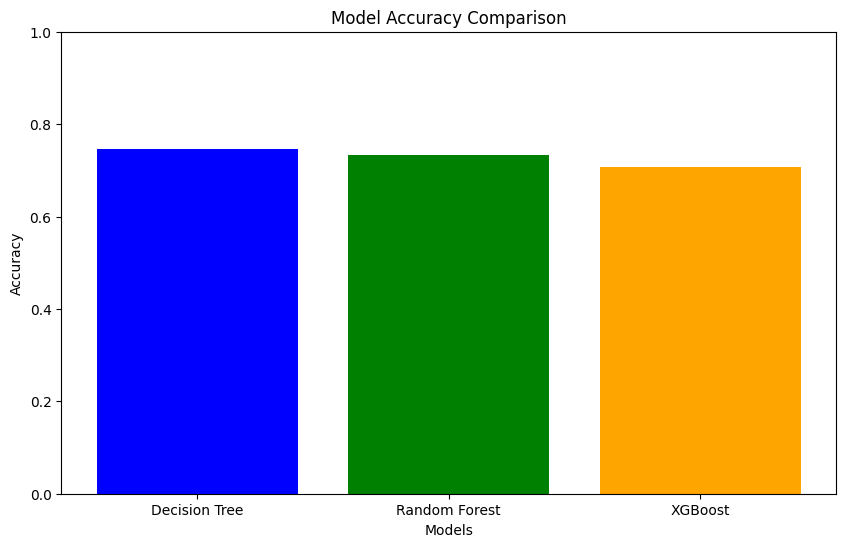
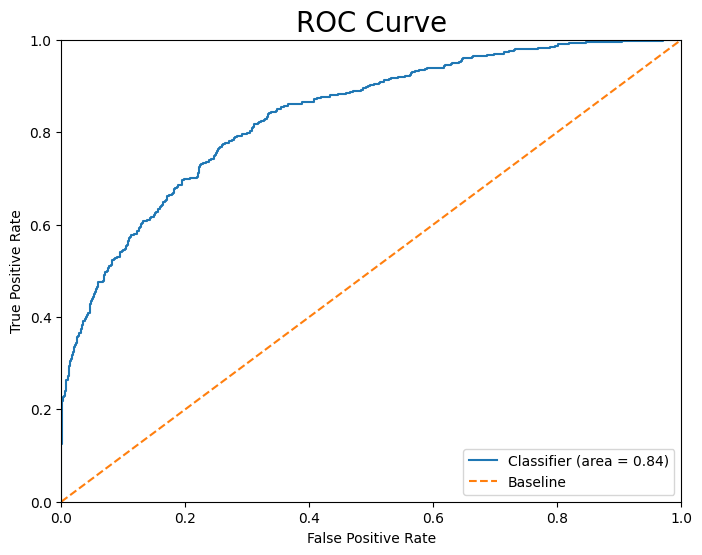
Problem: Financial institutions must identify and mitigate potential bias in lending outcomes across demographic groups while meeting regulatory and audit requirements.
Approach: Built supervised classification models on lending-style datasets and evaluated outcomes using fairness metrics and cohort analysis. Developed a Power BI dashboard to surface disparity indicators and model outputs in a format suitable for compliance and policy review.
Tech Stack: Python, scikit-learn, Power BI
Results & Impact:
What I'd Improve Next: Add model explainability (e.g., SHAP), automate bias monitoring, and implement alerting for threshold breaches.
Problem: Early identification of diabetes risk is critical for proactive clinical intervention and population health management.
Approach: Engineered predictive features from patient health indicators and trained classification models to estimate diabetes risk. Analyzed feature importance to highlight key contributors for clinician review.
Tech Stack: Python, Pandas, scikit-learn
Results & Impact:
What I'd Improve Next: Incorporate longitudinal patient data and evaluate calibration across demographic cohorts.
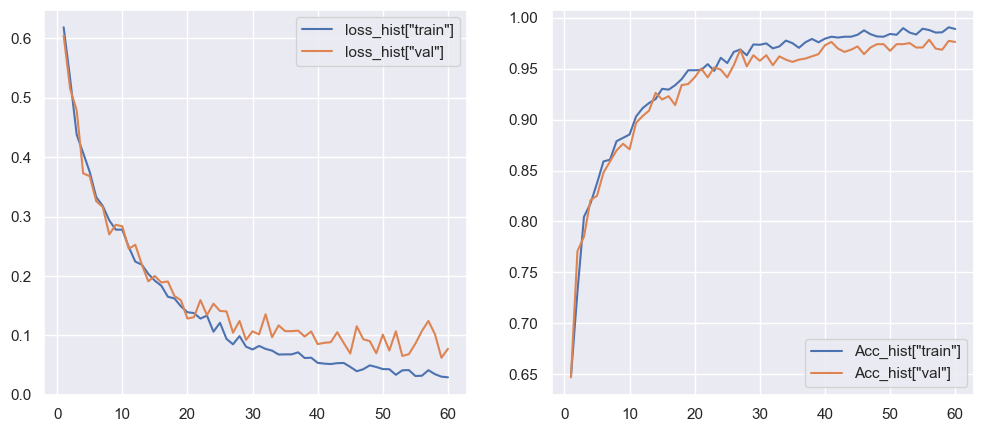
Problem: Manual review of MRI scans is time-intensive and subject to variability, motivating the need for automated screening support.
Approach: Designed a convolutional neural network pipeline for brain tumor classification using MRI images. Implemented training, validation, and evaluation workflows to assess model performance.
Tech Stack: PyTorch, CNNs, Computer Vision
Results & Impact:
What I'd Improve Next: Expand dataset diversity, test advanced architectures, and evaluate real-world generalization.
Problem: Customer attrition impacts revenue and growth, making early churn detection essential for retention strategies.
Approach: Built churn prediction models and segmented customers into risk cohorts. Generated churn scores to prioritize retention efforts and inform business strategy.
Tech Stack: Python, Machine Learning, Classification
Results & Impact:
What I'd Improve Next: Incorporate behavioral time-series features and test uplift or causal modeling approaches.
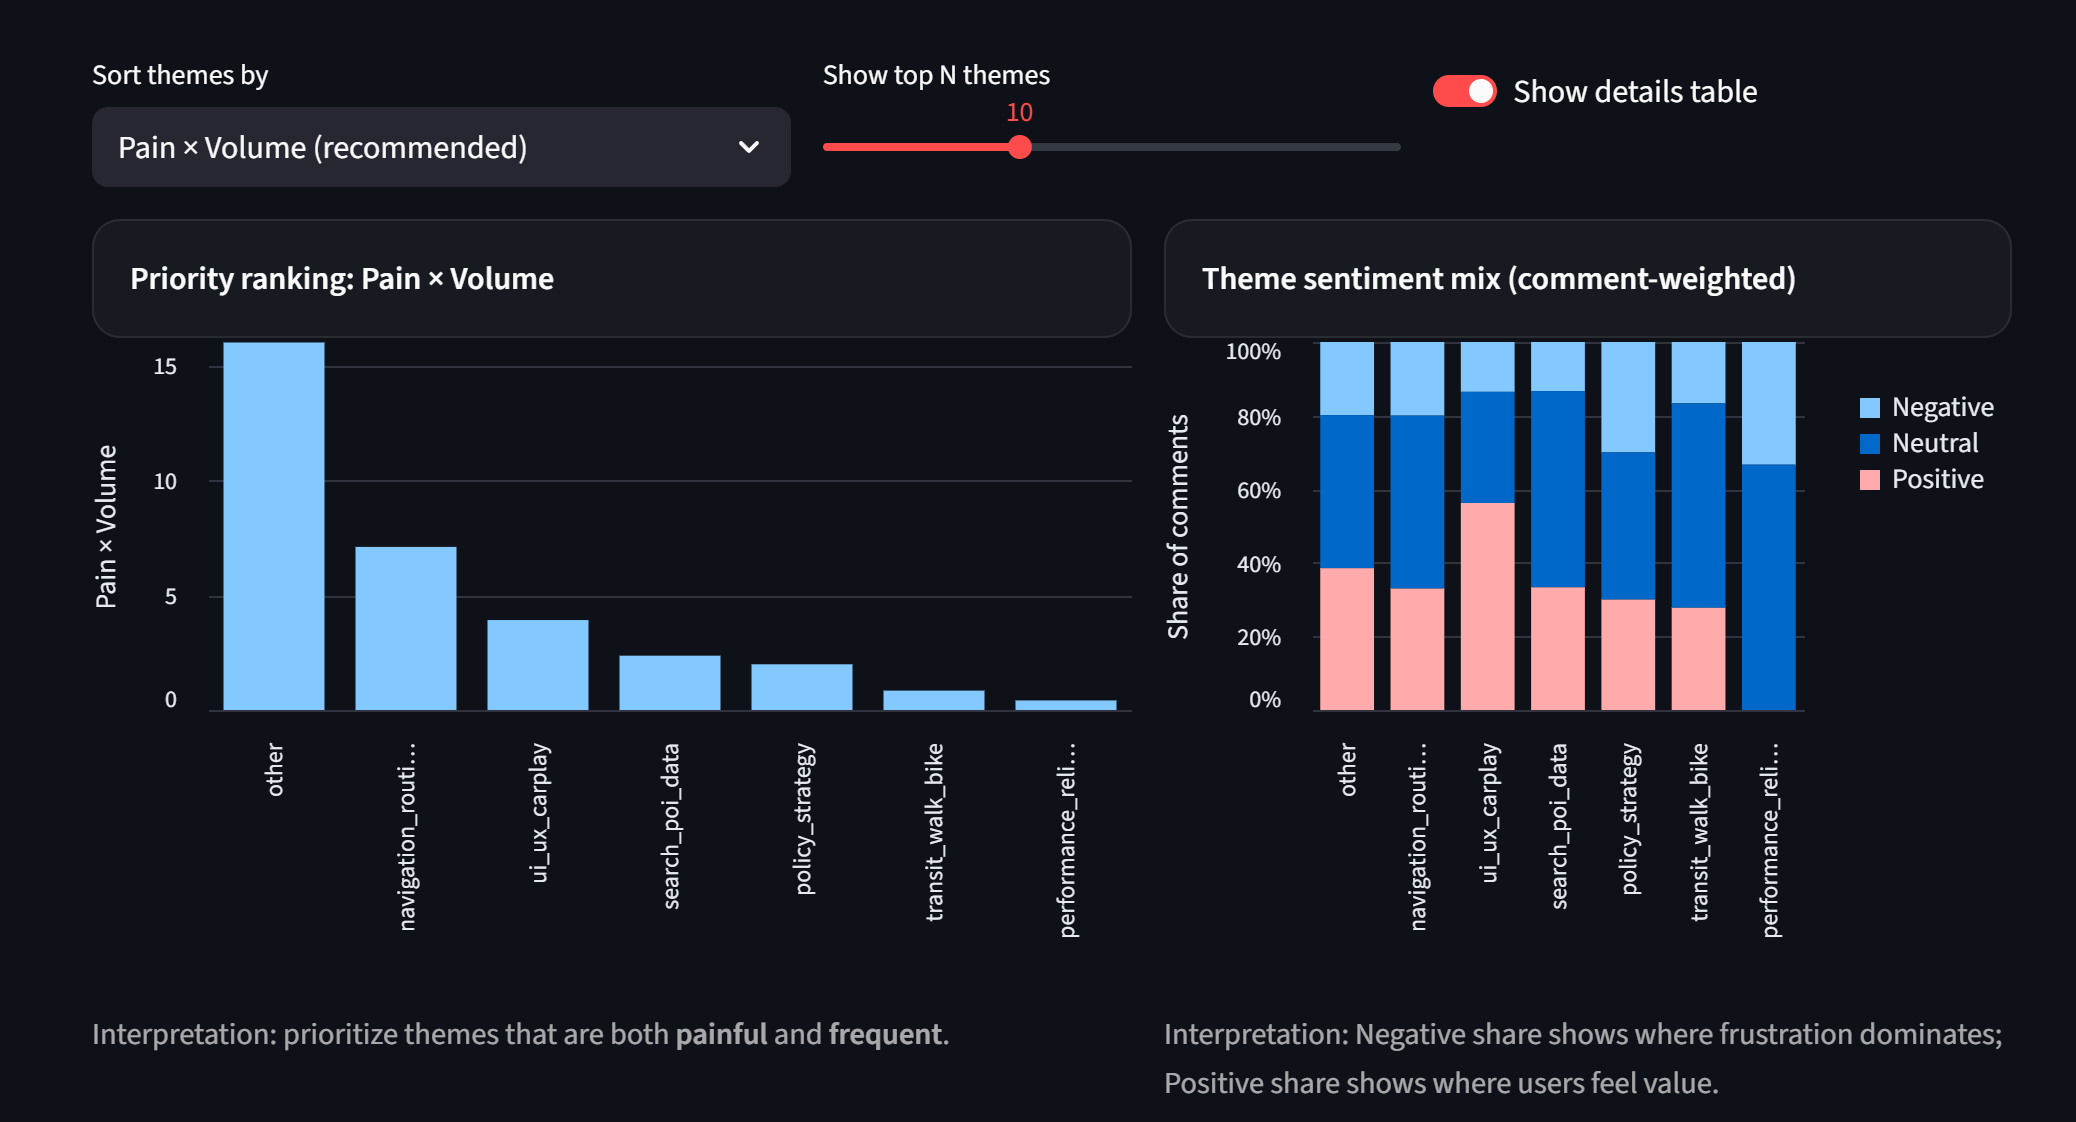
Problem: Understanding user experience issues at scale is critical for improving navigation quality, map accuracy, and overall product satisfaction.
Approach: Analyzed large-scale user feedback and issue reports using Python-based data analysis workflows. Performed exploratory analysis, trend segmentation, and aggregation to identify recurring experience pain points across regions and issue categories. Synthesized findings into structured insights aligned with product improvement objectives.
Tech Stack: Python, Pandas, Exploratory Data Analysis, Data Visualization
Results & Impact:
What I'd Improve Next: Incorporate sentiment analysis on text feedback, real-time monitoring, and experimentation to measure the impact of product changes.
Problem: Insurance claim analysts and customers need fast, accurate answers grounded in policy documents and claim guidelines. Generic LLM responses risk hallucination and lack regulatory reliability.
Approach: Built a Retrieval-Augmented Generation (RAG) system that combines document retrieval with large language model generation. Ingested insurance policy documents and claim guidelines, chunked and embedded text, and retrieved relevant context to ground LLM responses. Designed prompt templates to ensure factual, document-backed answers for claim-related queries.
Tech Stack: Python, RAG Architecture, LLMs, Embeddings, Vector Search
Results & Impact:
What I'd Improve Next: Add evaluation metrics for retrieval quality, introduce feedback loops for answer validation, and deploy a lightweight UI for analyst interaction.
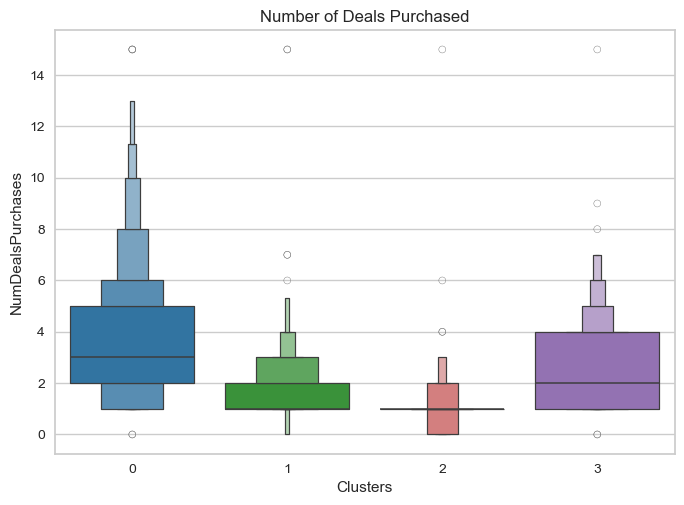
Problem: Businesses need clear customer segments to tailor marketing, personalization, and retention strategies effectively.
Approach: Segmented customers using behavioral and demographic data with clustering methods to uncover distinct customer groups and inform targeted actions.
Tech Stack: Python, Clustering, Customer Analytics, Business Insights
Results & Impact:
What I'd Improve Next: Add profile-based validation, automate refresh cadence, and connect segments to campaign performance tracking.
Problem: Understanding crime patterns is essential for public safety planning and resource allocation.
Approach: Analyzed historical crime data to identify seasonal trends, geographic hotspots, and clearance rates. Built interactive Tableau dashboards for exploratory analysis.
Tech Stack: Tableau, Data Visualization
Results & Impact:
What I'd Improve Next: Add predictive components and integrate demographic or socioeconomic datasets.